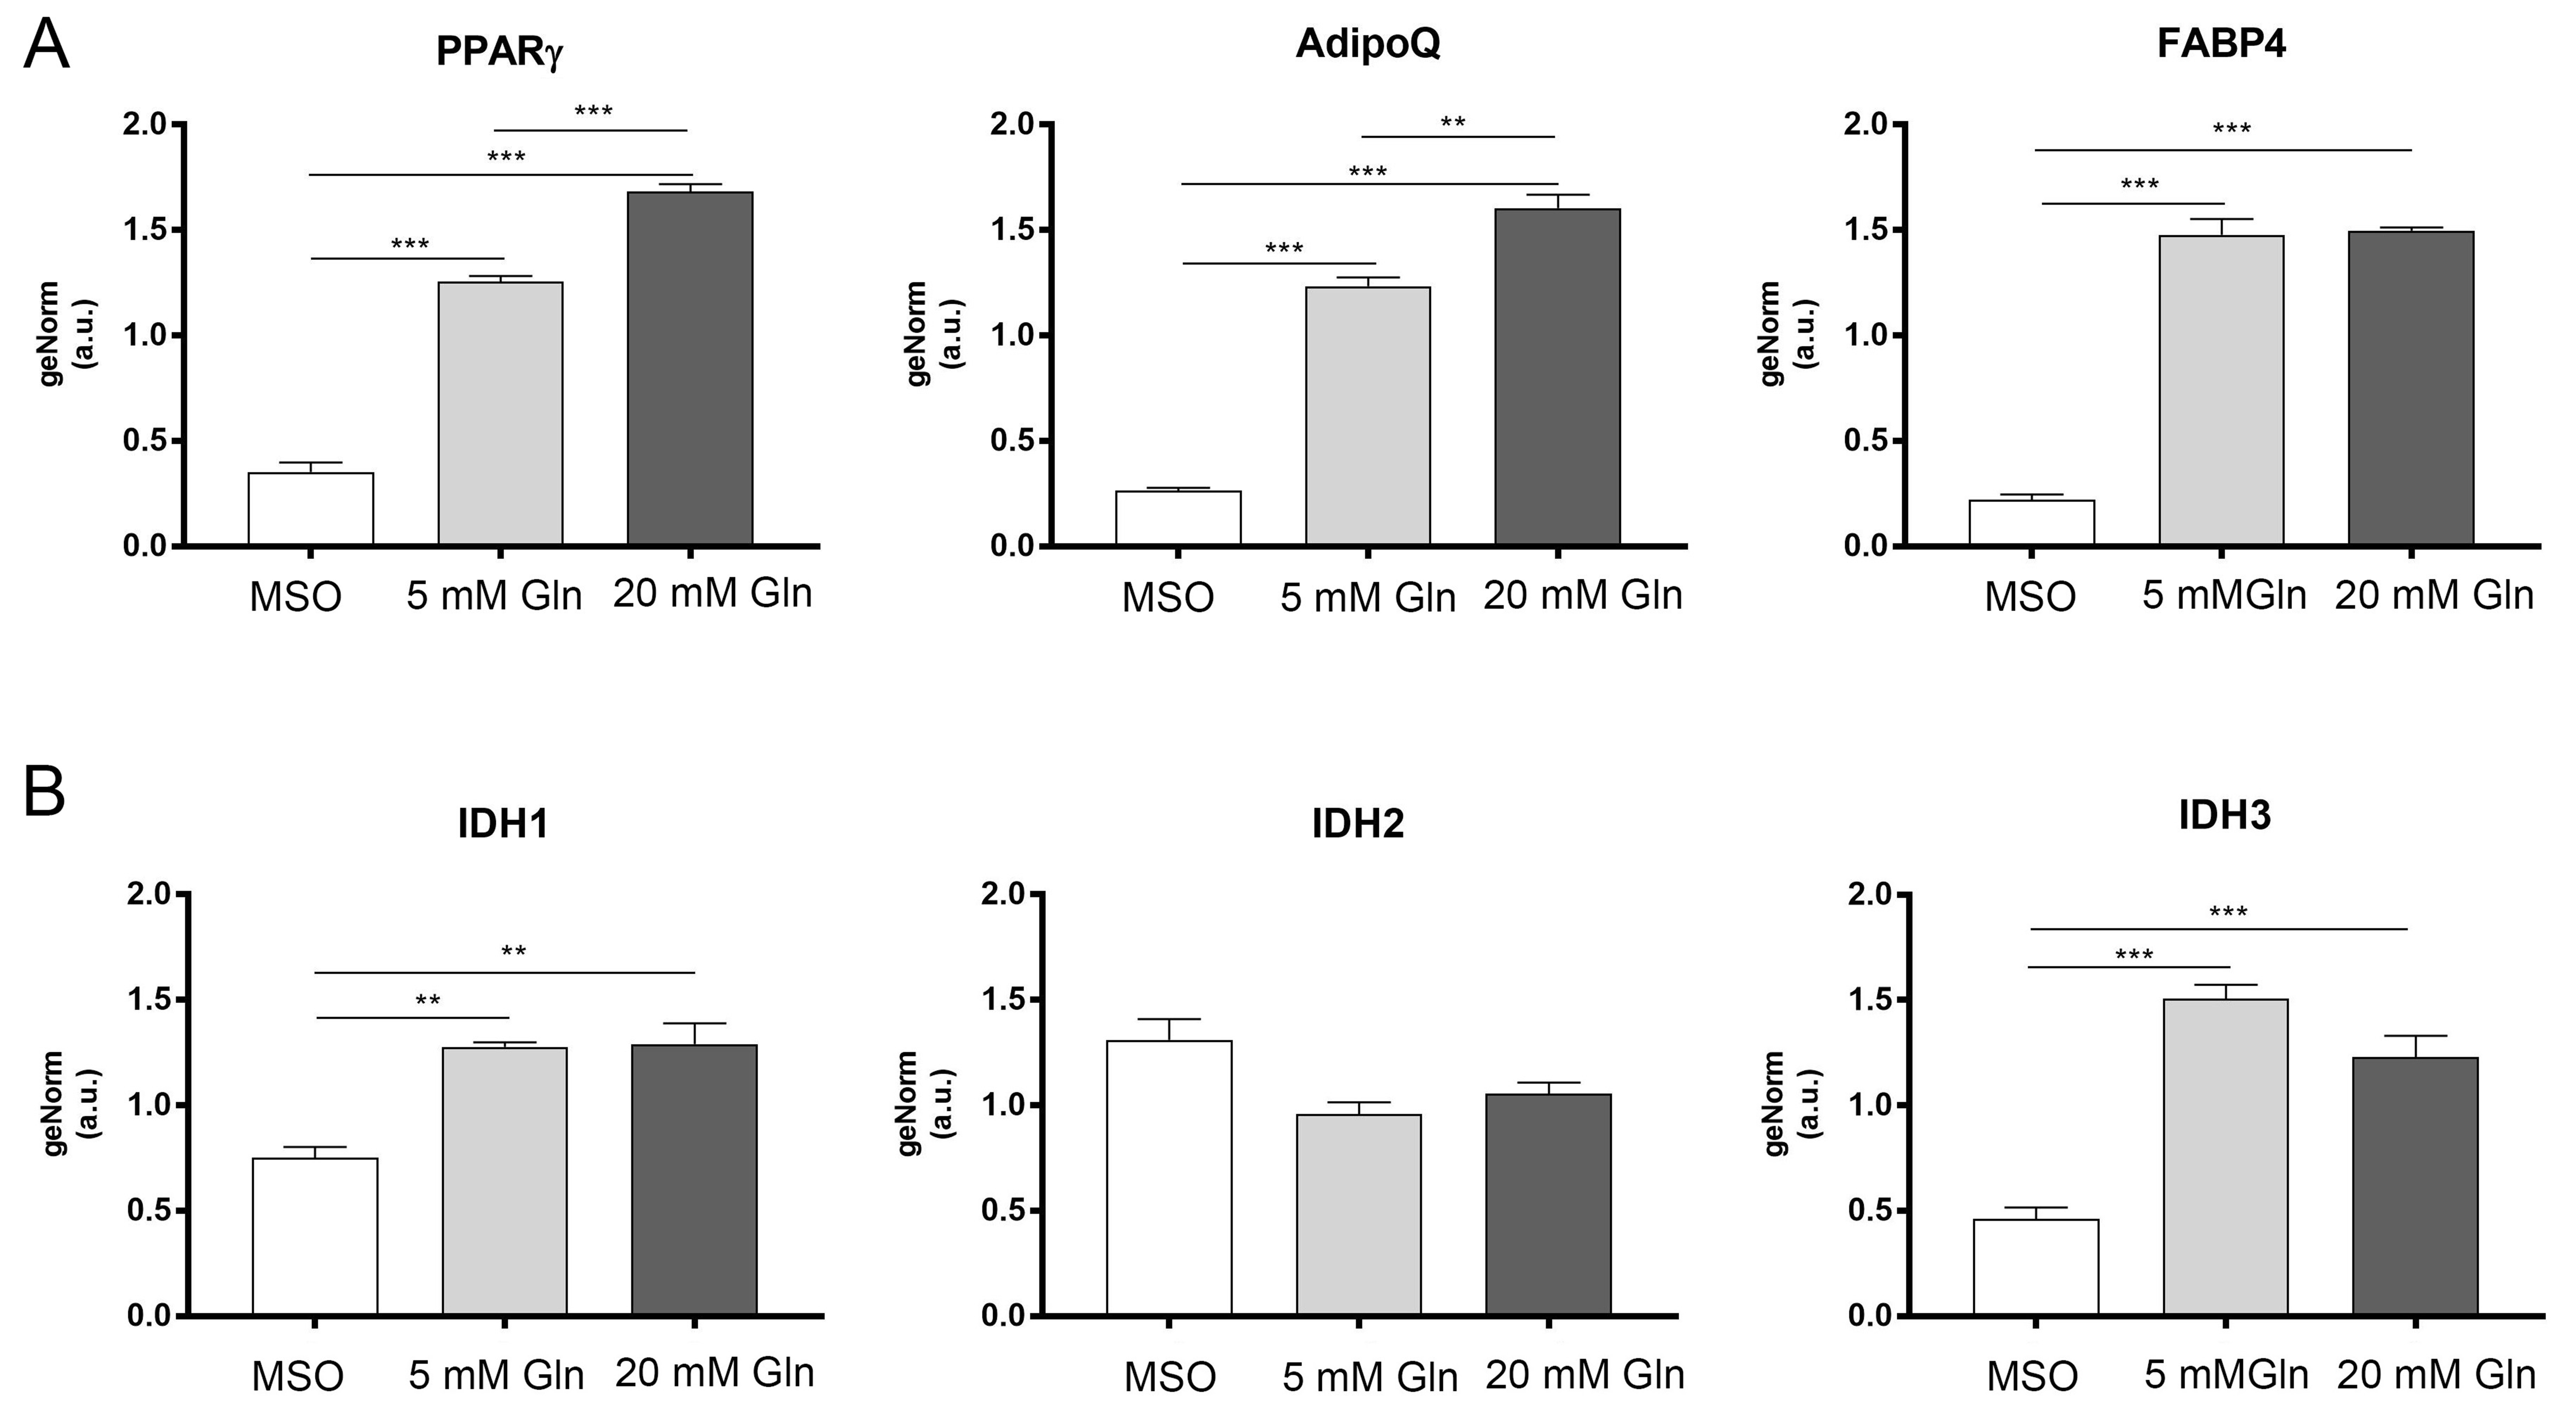
Fig. 4. Relative gene expression of adipogenic markers PPARγ, AdipoQ and FABP4 (A) and IDHs (B) in AD groups treated with MSO or supplemented with glutamine (5 and 20 mM, respectively). Data represent the mean ± SEM of three replicates; * p < 0.05; ** p < 0.01; ***p < 0.001.